Let’s say you want live sports, but you are at work. You are not allowed to watch the game on video, but there are several other options. One of them is to visit the event’s official website and use the section for live text commentary.
In text commentary, you will see a running log of the moments of the game. In football, the minute of the game serves as the lead, followed by a brief description of the action, e.g. “57′: Buffon saves a Ronaldo freekick by diving to his left.”. In cricket, you have the over and ball, followed by what happened, e.g. “17.4: Two runs. Kohli drives the ball to long-off, but Watson is in position to prevent the boundary.”
Not only sports, but other events like parliamentary sessions, seminars and board meetings are published the same way, e.g. “10:32 am: Mr. John Doe, Member of Parliament from Acme constituency, takes the mic.”
Let’s take this to the world of technology, with sensors recording the current temperature or an online analytics tool that watches every minute you watch a movie online, shop or read a blog. These tools record a minute-by-minute about what’s going on in the surroundings or what the user is doing on a website. In fact, minute-by-minute is an understatement and it is rather microsecond-by-microsecond. To help record this, the world of technology uses a special type of database called the time-series database.
Properties of time series DB
- Timestamp is the leading field: In a time series database, the leading field is the timestamp at which the action takes place. This is in contrast to storage for something like a telephone book. In a telephone book, the leading field is the name of the person you are looking for. The search starts from the person’s name, until you find the person and get his/her details. The data doesn’t change often and you don’t usually add numbers at a rapid rate. At besst, you will add a new number every day or perhaps 5 new numbers every day if your work requires meeting that many new people and building that many contacts.
In a time series DB, the data leads by the timestamp. The searches and the analysis are done keeping a range of time in mind, e.g. over the past 24 hours, last week, last year, etc. The subject data, such as temperature or user activity, follows the timestamp.
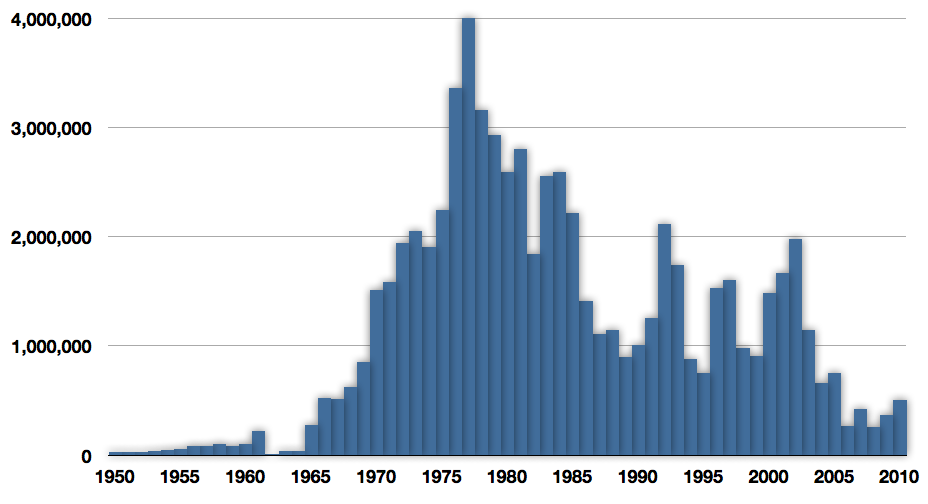
If one were to plot a chart using a time-series DB, the timestamp or a period of time, such as hours, months or years always end up as the X-axis of the chart.
- Old records are never changed, new ones are added: In a time series DB, old records are never changed. New data is always recorded at the end of the table, using the latest date and time. This is in contrast to a phone book, where you will replace old phone numbers with new ones, discarding the old one. But if a temperature sensor takes a new temperature reading, usually a new record with the time of reading is created, rather than replacing a field in a single record called ‘latest temperature’.
- You can spot trends: Because of such obsessive recording and never getting rid of previous data, time series DB shows a trend over time. You will notice changes and spot a curve. Usually in a telephone directory, all old numbers for a person are discarded when a new one is recorded. But imagine for a moment, that you treat a telephone directory like a time series DB. If you were to keep all the old phone numbers and rather note the new phone number along with the date and time of the change, you will start noticing patterns. If you have been following this person for a decade or more, you will notice the change of technology from landline phones to mobile phones. You will see how often people change mobile service providers on an average and how often people move between cities or countries on an average. Trend spotting is the main purpose for using time series DBs.
- You may have trends inside trends depending on what you record: Time-series data can different amounts of data recorded along with the timestamp. This depends on the application.
Some records need nothing beside the timestamp. This is usually sufficient when there is only one source of data and the time itself is the trend being analysed. If your goal is to track the sunrise and sunset timings from your bedroom window every day, then all you need is the timestamp. This itself should show how sunrise advances in summer and retreats in winter and vice-versa for sunset. It shows how much daylight you have as the year and seasons progress.
Another application is to have a timestamp and a single number. This is good when you have a single source for data and when you are measuring a trend other than time. E.g. the number of units of electricity your home consumes every hour can be tracked by getting readings of your metre. You need to record the timestamp and the number of watts consumed.
Most applications however need to record the timestamp, a number and then several fields that indicate the context. E.g. along with timestamp and temperature, the city where it is measured is also recorded. Online analytics are usually recorded along with the user’s cookie to track individual users. Their device details are also recorded.
This starts showing trends inside trends. E.g. you get to know how the temperatures in individual cities have undergone changes over the years. You get to know which pages / products individual users visit and how more mobile devices are used for viewing your blog these days.
When should I use a dedicated time-series DB solution?
It may not be easy to know beforehand, whether to use a regular relational / document-based database or a dedicated time-series one. But here are some tips to decide when a time-series DB is better.
- You are recording every or most events occurring on your system and timestamping them.
- Your timestamped data runs into thousands or tens of thousands per day.
- With all the data, you are performing statistical analysis, using aggregation, averages, standard deviation, etc.
Existing solutions
Here are some time-series database solutions. Note that these are seperate from relational database solutions like Oracle or MySQL and also from document-based databases like MongoDB / Cassandra.
- InfluxDB: This is the rock star of the lot. InfluxDB is used by some of the leaders in the world, such as IBM and Cisco. Besides installing InfluxDB yourself, you can use their hosted version described on their website. The officially supported programming language is Go, but you can find libraries for Java, JavaScript and Python.
- RRDTool: This was not started as a time-series DB, but rather a place to collect logs and then perform analysis on them. This project is more than a decade old. But with the term ‘time-series DB’ coined, RRDTool have rebranded themselves as just that.
- Graphite: Written in Python, Graphite comes with both the core database and a web-based UI for data entry and processing. For basic needs, this web-based interface is enough. For advanced statistics, you need to learn its API. The official language for the tool is Python, though other languages are supported.
Advantages
Since time-series DBs are meant for a humungous amount of timestamped data, they are optimised for such applications. Reads, writes and searches by time ranges are faster. There are pre-built tools for common statistical calculations such as regression, histograms and even CAGR (if you use time-series DBs for technical analysis of stocks).
Problems with existing solutions
Time-series DBs are neither compatible with SQL queries, nor with relational databases like MySQL. You need to maintain seperate databases for timestamped and non-timestamped data. This is because, unless data is timestamped, time-series DBs are slower, e.g. for a phone directory or a database of all customers’s bank accounts. So you need to keep your non-timestamped data seperately for those queries to work efficiently. You application needs to manually sync data between the two databases.
You need to learn programming to be able to query time-series databases, since most of them don’t support SQL queries yet.
SQL-ready solutions
There are a few solutions that are SQL-ready and you can use SQL queries to query data. Here are two.
- extremeDB: is proprietary and closed-source with a free trial of 15 days.
- TimescaleDB: is open-source and is a modified version of a stable, time-test relational DB solution named PostGreSQL.
Conclusion
If you have huge set of time-stamped data generated over a long time, running into tens of thousands and millions and you need to spot trends, then time series DB may be for you.