
You may have started your dream app, launched your much wanted app or set up your e-Commerce site. But once that is done, you will want to measure how well you site / app does. This is what analytics helps achieve. Analytics have now been around for a really long time, but of late they have grown really complicated and beginners are struggling to understand what to measure and what to make of all the gathered data.
Companies like Google, Flurry, Countly and several others have been investing millions to make their analytics as accurate and insightful as possible. In this post, I shall explain to you what you need to know about analytics in a nutshell and what are the basic measurements that are minimum necessities to know how well your website / app is doing.
What is analytics?
If you have a website or an app, there obviously will be pages, screens, actions, touch points and inputs. A website or an app is called a ‘property’ in Analytics parlance and the various components such as pages and screens are called ‘events’, since the user ends up entering or exiting from those components, thus triggering events. Analytics helps us measure how many times each event occurred in a property over a period of time. Analytics also helps us drill down each event to see how many occurred across different times of the day, geography and technology variables such as device, operating system, software version and screen sizes. Finally, analytics helps us measure user engagement such as how many pages a user visited, how long he/she was active on each screen and what calls to action he/she took, such as sharing on social media, buying goods and subscribing to a newsletter.
How does analytics work?
At the very basic level, an analytics setup needs the property to talk to an analytics service for each event, so that the event is recorded by the service. To record an event, the property makes an API call to the service and passes some parameters regarding the event. The service then records the event in its database. In case of web analytics, the API call may be as super simple as loading a 1 x 1 pixel transparent image from the analytics service’s web server. This was heavily used during the days when JavaScript was at its infancy and not all browsers, especially mobile ones, supported it.
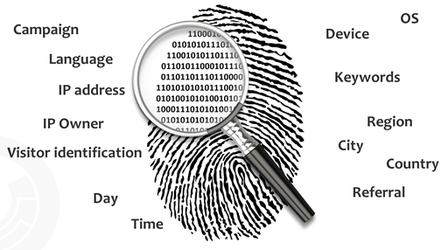
To make sure that all events coming from the same user are attributed to that user, technologies such as cookies are used. However, since cookies may not be enabled by every user, new methods called ‘fingerprinting methods’ are used to keep note of events occuring from the same user.
Real-time vs Deferred
As mentioned above, a property needs to make a call to the analytics service so that an event is recorded. When a property is able to do this for every single event as soon as it occurs, it is possible to make the latest count of events on an almost immediate basis. This is called real-time analytics.
However, this may not always be possible, especially in mobile app analytics. For one, the Internet connection is not always at its best. Secondly, frequent hits to the server needs the mobile device to stay awake and keep its connection on all the time and that can lead to battery drain. In such cases, a trade-off is made and events are batched up in the mobile device itself and a big batch of events is sent over to the analytics server after long intervals of time.
Metrics and dimensions
Whenever we pick an analytics services, we will come across two terminologies. Google Analytics in particular uses the exact words as used in my title. Metrics are the actual numbers that are measured. E.g. Number of times a page is viewed, the number of times a button was clicked, number of users who visited the website, etc. Dimension on the other hand helps split the metrics into more useful data by dicing them up. E.g. country, device brand and model, hour of the day, source which led the user to download the app, etc. Combining a metric and one or two dimensions gives us meaningful and benchmarkable data that can be used to drive more user engagement and improve the property. E.g. page views over the last 24 hours, number of Indians who clicked on Buy Now button, number of Samsung mobile users who used the app for at least 90 seconds and so on.
Most commonly used metrics and dimensions
Let us understand some of the most commonly used metrics and dimensions, typically the ones that you will be using to measure the success of your property.
- Page view – This is the most basic metric. Every time a page / screen is viewed by a user, it counts as a page view.
- User / visitor – As mentioned in the previous section, an analytics service is able to track a particular user to either a single device or a set of devices using either cookies or proprietary finger-printing techniques. The count of users is the number of unique users that the analytics service has identified. Depending on the availability of cookies and the strength of finger-printing, this metric may be able to correctly identify the same user across multiple visits to a property or even multiple visits using multiple devices.
The term visitor is used interchangeably with user and means one unique person who visits / uses the property. - Session / visit – The accuracy of this metric depends on the accuracy of the user metric. A session or a visit is a single thread of usage by a particular user. To put in simpler words, a session tracks a user from the time that he/she enters a property upto the time that he/she exits it. During a session/visit, a user may consume multiple pageviews. In fact, the more the user consumes, the more engaging the property is considered for a user.
- Pages per session – This is the average number of pages that each user views during a session in the property.
- Bounce – These are sessions in which the user accounts for only one page view. It is called a bounce because a user has typically entered the page and exited it immediately.
- Bounce rate – This is the percentage of bounce sessions against sessions in which a user has stayed more engaged (i.e. viewed at least 2 pages or more during a session).
- New users – This is the count of all the users who had not previously visited the property. Typically these will be users who do not have a cookie already set by the analytics service or users who were not identified by the finger-printing methods. Most world-class analytics services are successfully able to identify genuinely new users, but inferior services often fail to identify revisiting users and mark them as new users.
- Referrer – This is typically the URL of a web page which has led a user to our property. Referrer counting is used to keep count of which sources are leading to the most and the best traffic to the property and can be used to form strategic partnerships.
- Time on page – This is the average time spent by a user on a particular screen. This is measured by tracking the time when the user entered a page upto the time when he exited the page / entered a new page.
- Time per session – Time per session is the average time spent by users in one session. Session time is measured by totalling up the time spent by a user on each and every page during that session. The session times of all the users are then averaged out to find the average time per session on the property.
- Conversion – Every website / app has many touch points for the user, but there is generally one action that is considered the most important. If a visit from a user leads to the most important touch point, then that visit is said to be converted.
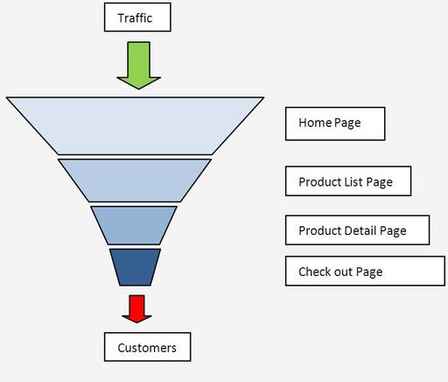
E.g. An e-Commerce website calls it a conversion if a visitor buys something from it. An photo album app will consider it a conversion when the user clicks and uploads at least one photo. A blog will consider it a conversion when a user signs up for its mailing list. - Funnel – Consider an e-Commerce website. A user signs up, browses for products, looks up details of a particular product, chooses to buy it, fills out the order form, fills up credit card details and completes the payment and with that, facilitates an order. As you can see, there is a sequence of events. Now considering all the users who visit the e-Commerce website throughout the day, many of them land up at the home page, a fraction of them sign up, until finally a small number of them end up buying something. If we were to represent the events based on their frequencies as circles on top of each other, starting from landing up at the website until the conversion event, we would see a funnel, with a wide top and a narrow bottom.
Funnels are a visual cue to gauge how well our property is doing in terms of engaging the user and getting us business. A funnel which looks more vertical, i.e. as close to a cylinder as possible is that of a successful property. However if the sides slope too much and we are left with too wide a top and too narrow a bottom, then it is time for the company to re-evaluate if the property is really working for the user as they want it to.
Here is another blog that explains the above concepts in a clear manner. It is a blog for a beginner’s guide to Google Analytics.
Conclusion
Analytics are extremely vital in order to measure how well a property is doing. However, do beware of over-analysis. Two or three key number are generally sufficient to indicate progress. Too many will cause an analysis paralysis, which will lead to too much information and no conceivable insight and action.
How are you using analytics to measure the success of your property? How many metrics and which metrics are your key indicators to success? Let me know in your comments.
Valuable info that every online entrepreneur has to know shared in simple no-jargon language as always. Keep up the great work.